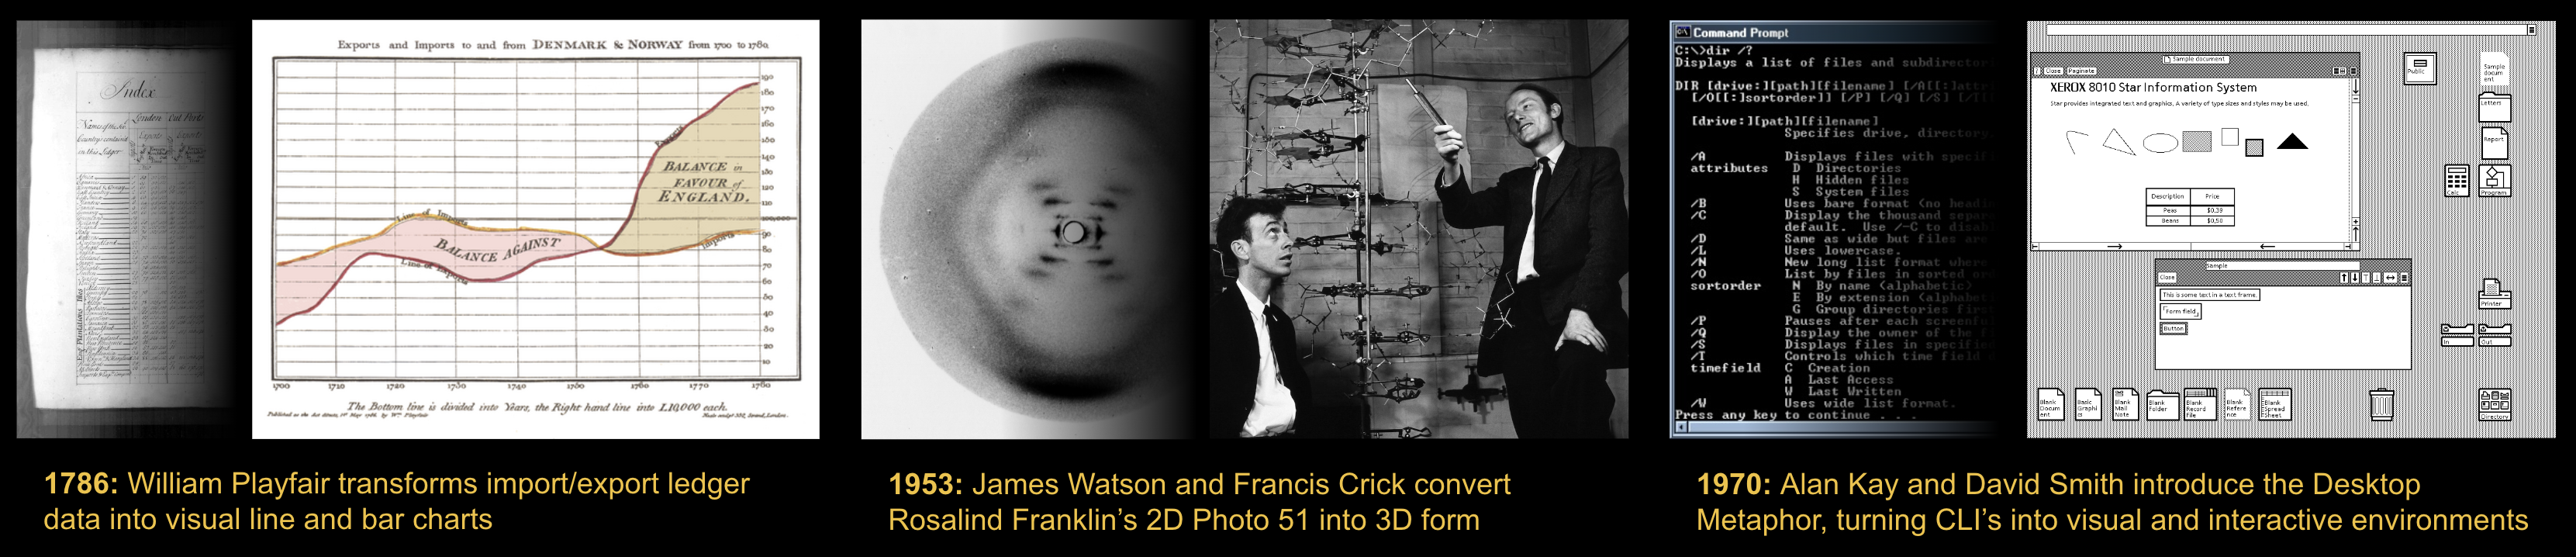
Throughout history, new ways of seeing information have expanded what humans can think. William Playfair turned trade ledgers into line charts. Watson and Crick converted Rosalind Franklin's 2D photo into a 3D model of DNA. Alan Kay and David Smith turned the command line into a graphical desktop. Each of these representations made complex systems legible in ways their predecessors could not.
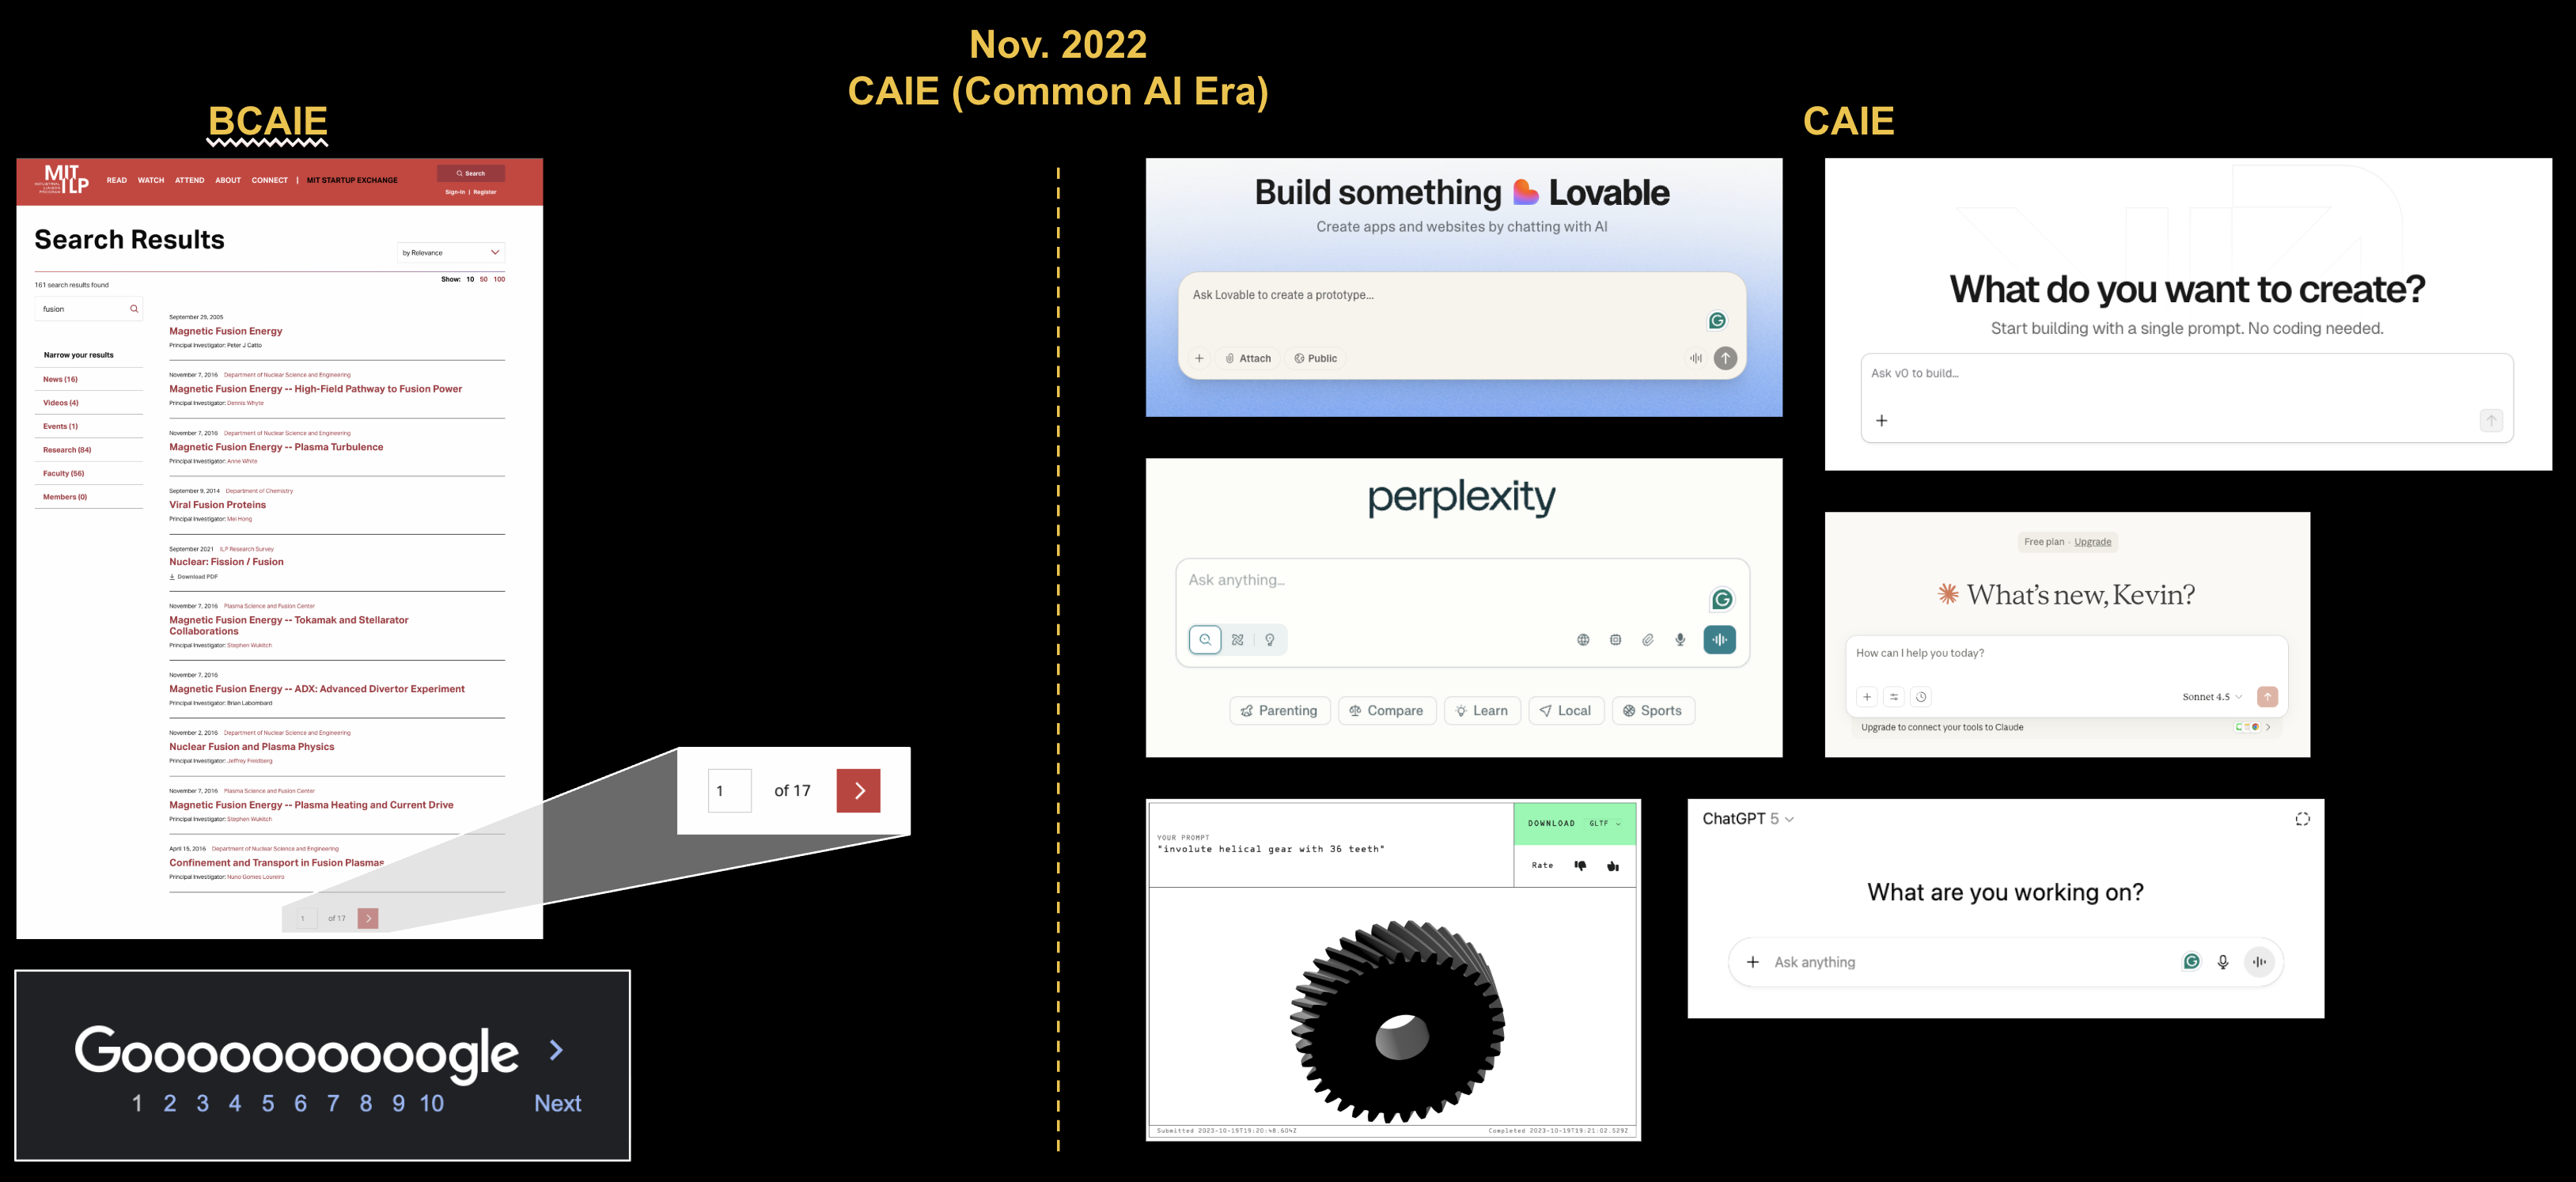
We have no equivalent for internet-scale unstructured data. Millions of academic papers are published each year. Billions of social media posts appear each day. Generative AI is accelerating this further as the cost of producing content trends toward zero. The dominant interfaces for working with all of this, search and chat, each have fundamental limitations. Search gives you a ranked list: no overview, no connections, and you never go past page one. Chat provides synthesis but is opaque, collapses breadth, and shifts agency from the user to the system. Neither lets you see the shape of your information.
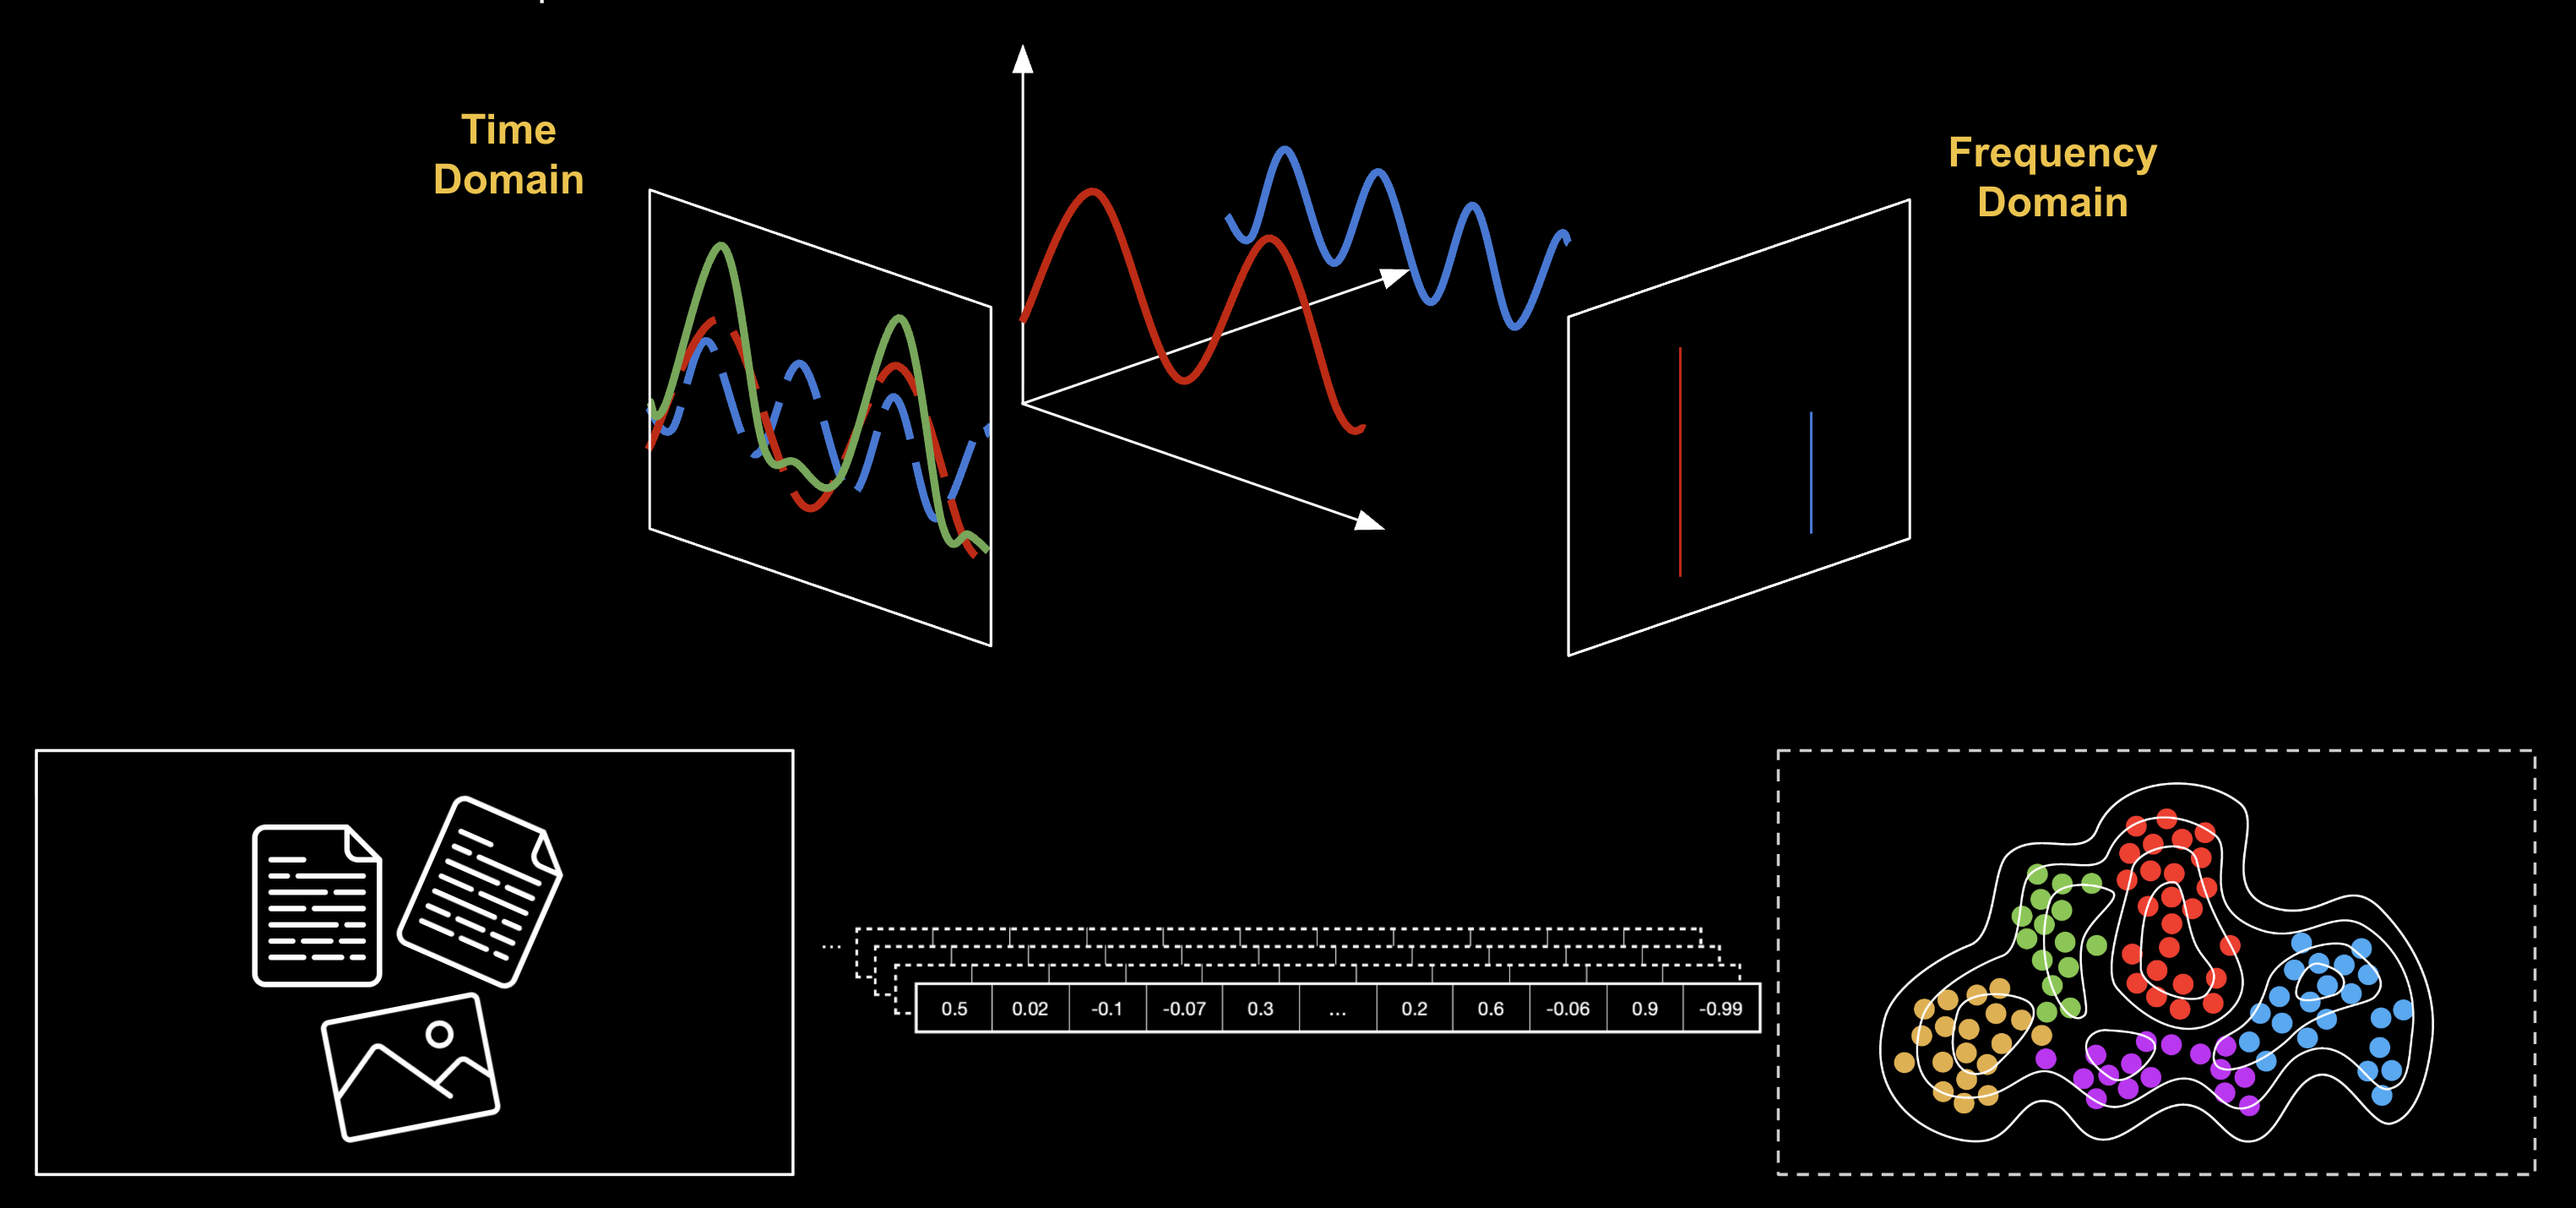
Latent Lab is a platform I built to explore whether embedding-based spatial interfaces can fill this gap and serve as a "spectrogram for text." It takes large sets of unstructured information (documents, images, media) and, with minimal effort on the user's end, creates interactive 2D and 3D visualizations where meaning is encoded in position. Items that are semantically similar appear near each other. Clusters, outliers, and relationships become visible at a glance.
The system supports automated topic labeling at multiple scales, with filtering to isolate specific research areas. Users can explore topics by zooming into dense clusters or filtering by keyword, revealing sub-themes and connections that would be invisible in a traditional list. The topographic contour lines encode density, making it immediately clear where activity is concentrated.
Temporal sliders reveal how a dataset evolves over time. By scrubbing through a timeline, users can watch topics emerge, grow, and fade, turning a static snapshot into a living history. This feature has proven particularly useful for understanding how research fields develop and shift focus across years.
Semantic axes allow users to define their own organizational dimensions. Instead of relying solely on the algorithm's 2D projection, users can specify meaningful axes, such as "climate change" on the Y-axis and time on the X-axis, to see how their data distributes along concepts they care about. This transforms the visualization from a fixed map into a flexible analytical tool.
Visual RAG lets users see exactly which items inform a generated response. Rather than a black-box answer, the visualization highlights the source documents spatially, so users can evaluate coverage, identify gaps, and understand the provenance of synthesized information. This bridges the gap between AI-generated summaries and the underlying data.
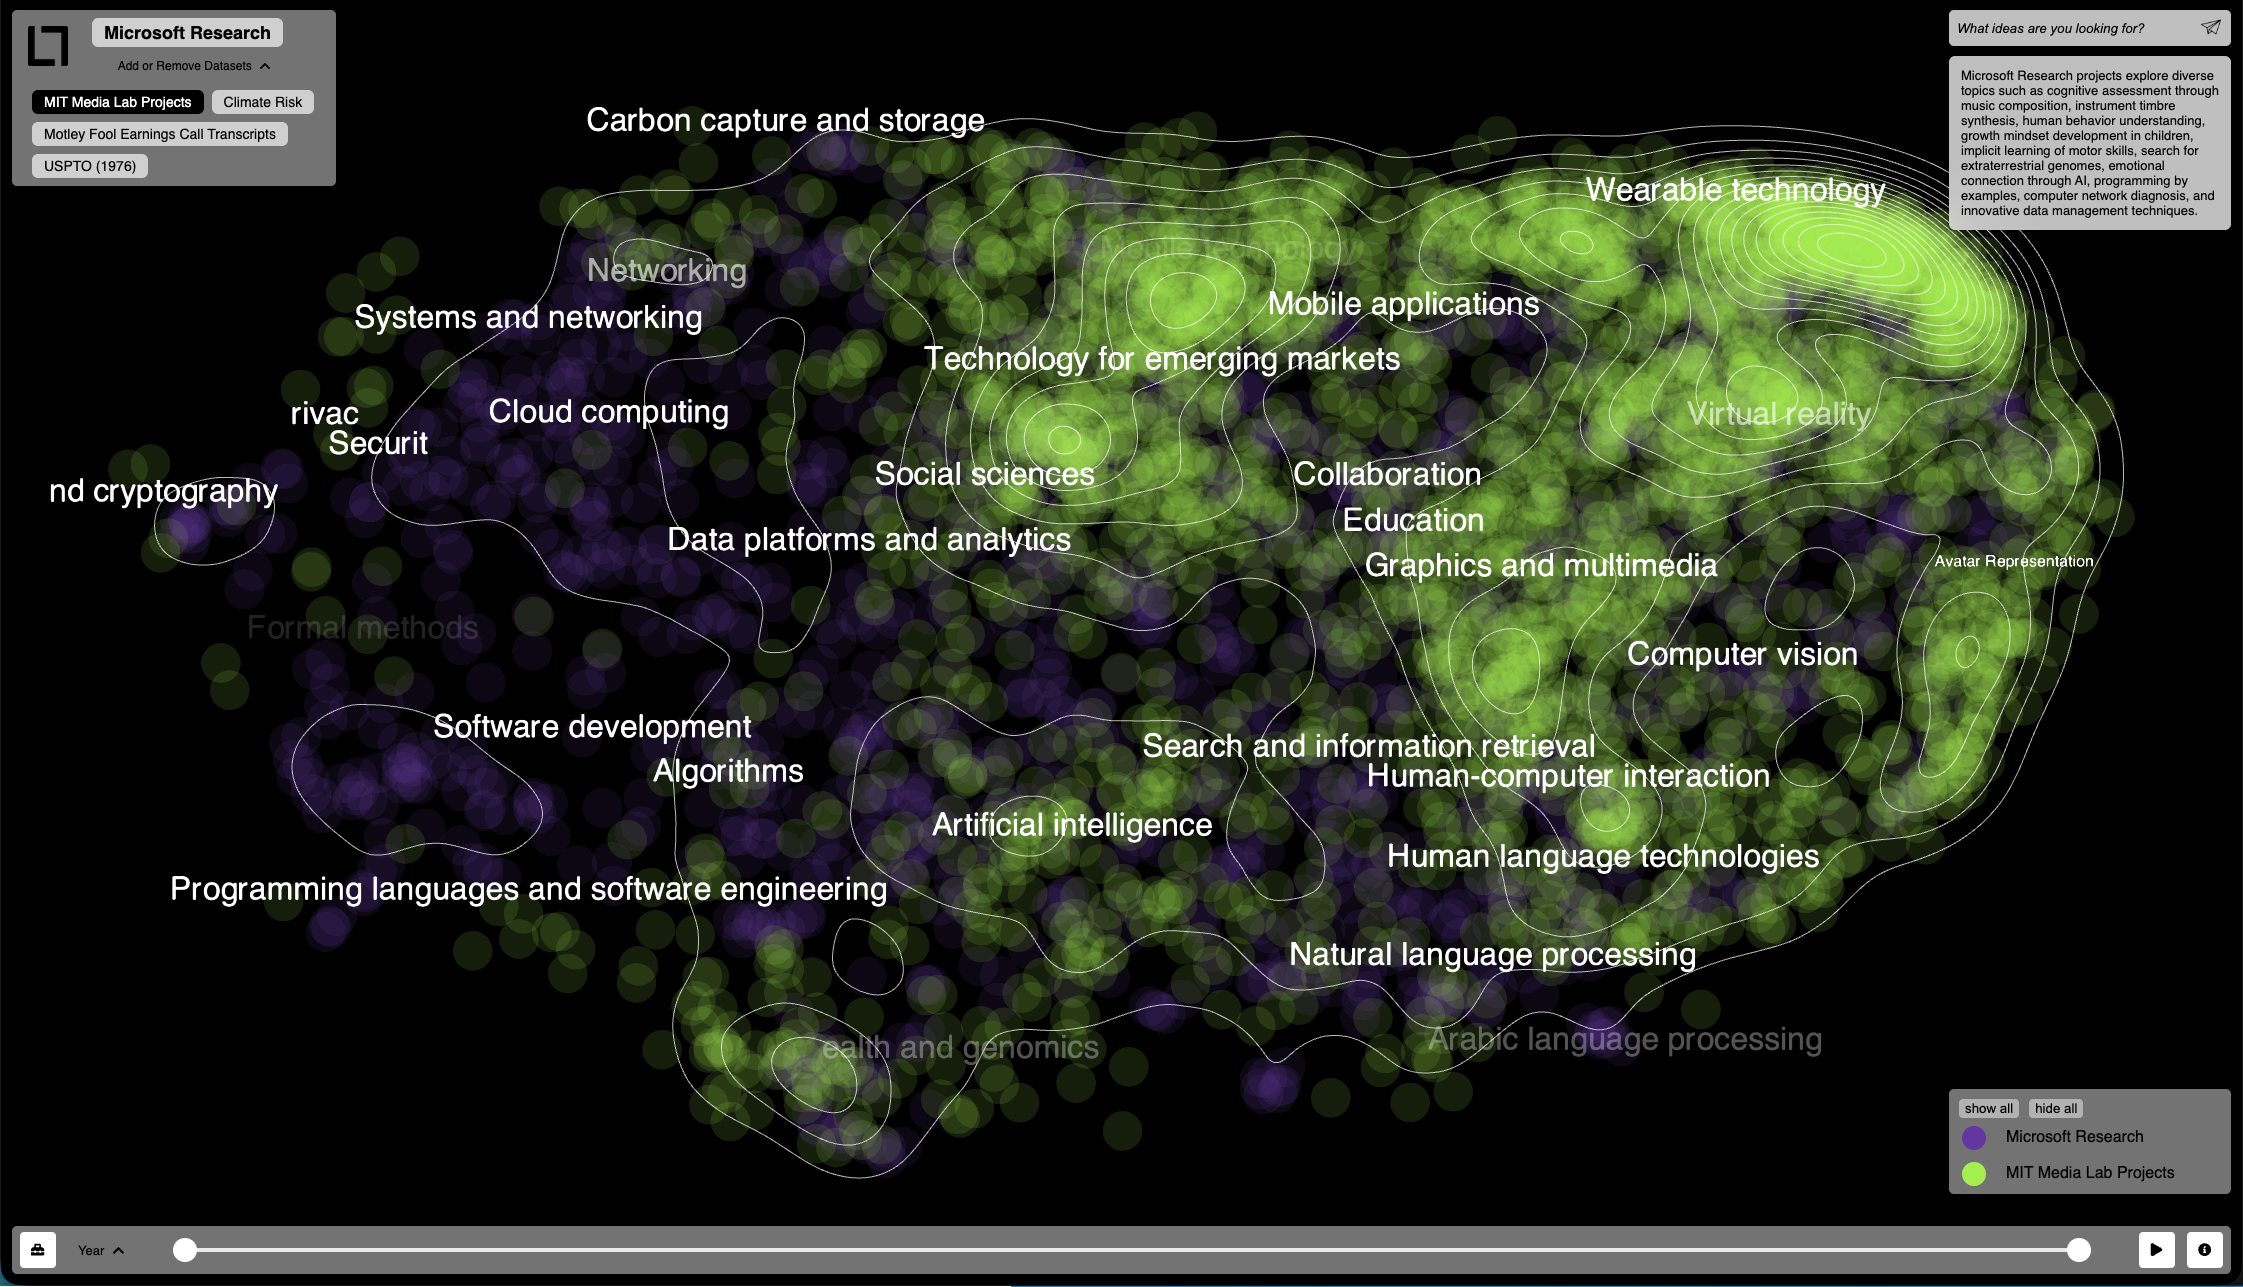
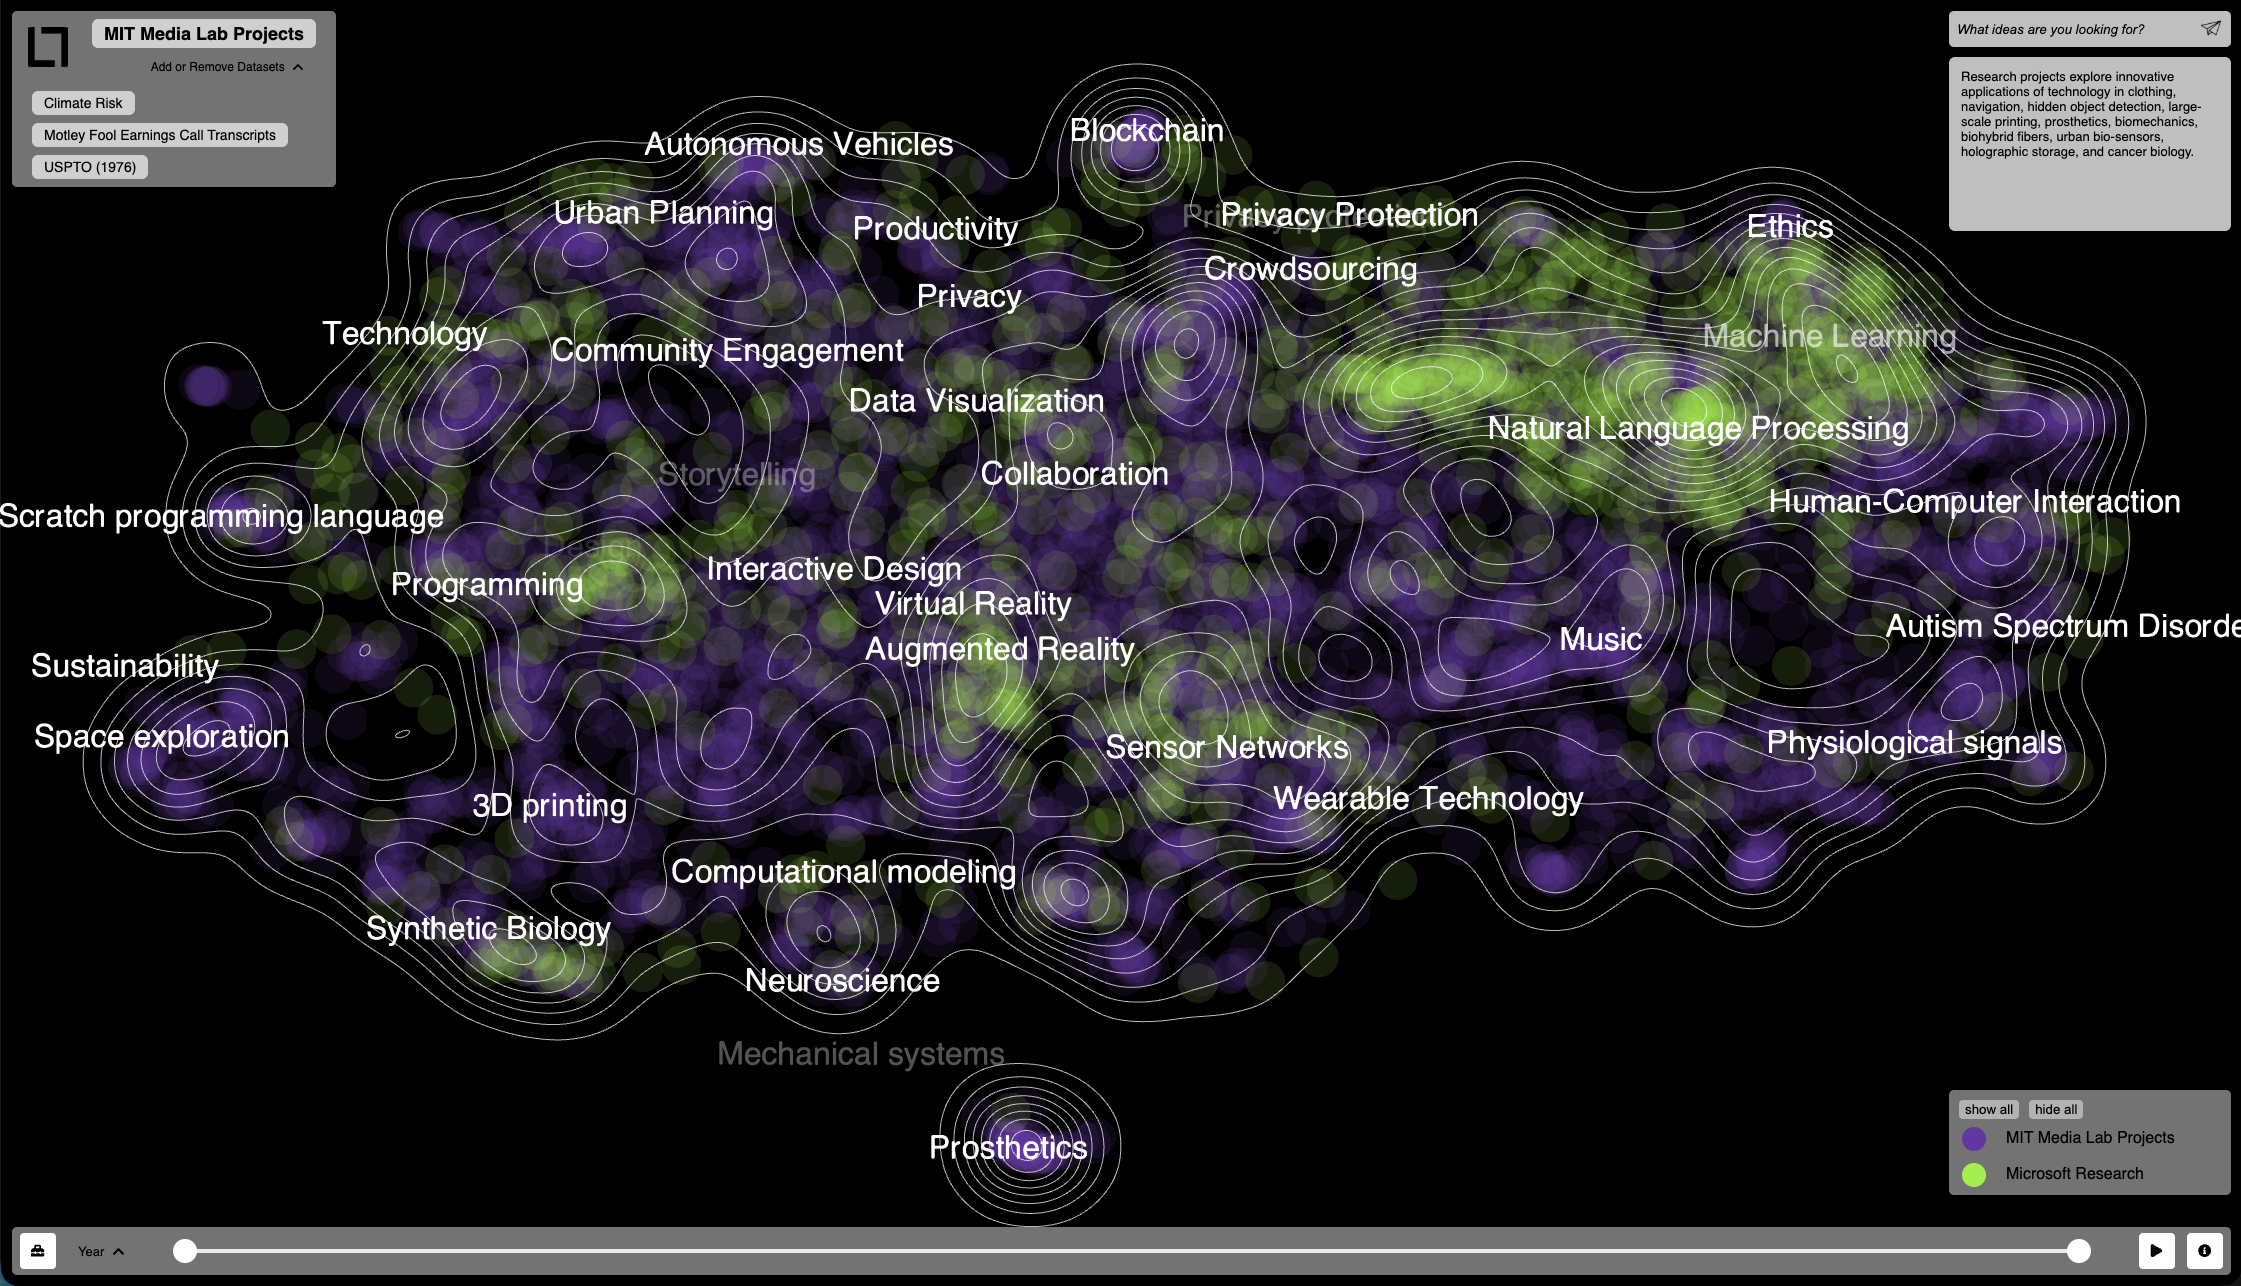
Dataset overlays enable comparative analysis by layering multiple collections in the same semantic space. Here, MIT Media Lab projects and Microsoft Research projects are overlaid, revealing where the two institutions share focus and where they diverge. The ability to see one organization's work in the context of another's has been valuable for competitive intelligence and strategic planning.
In a study with 94 researchers comparing Latent Lab to a conventional list-based interface, we found significant improvements in insight extraction, mental support, and engagement during open-ended exploration. The tool has also been adopted by sponsors including Dell, HP, Deloitte, and Kenvue for applications ranging from patent analysis to competitive intelligence. The patent landscape shown here illustrates how the platform scales to large, domain-specific datasets like the USPTO corpus.
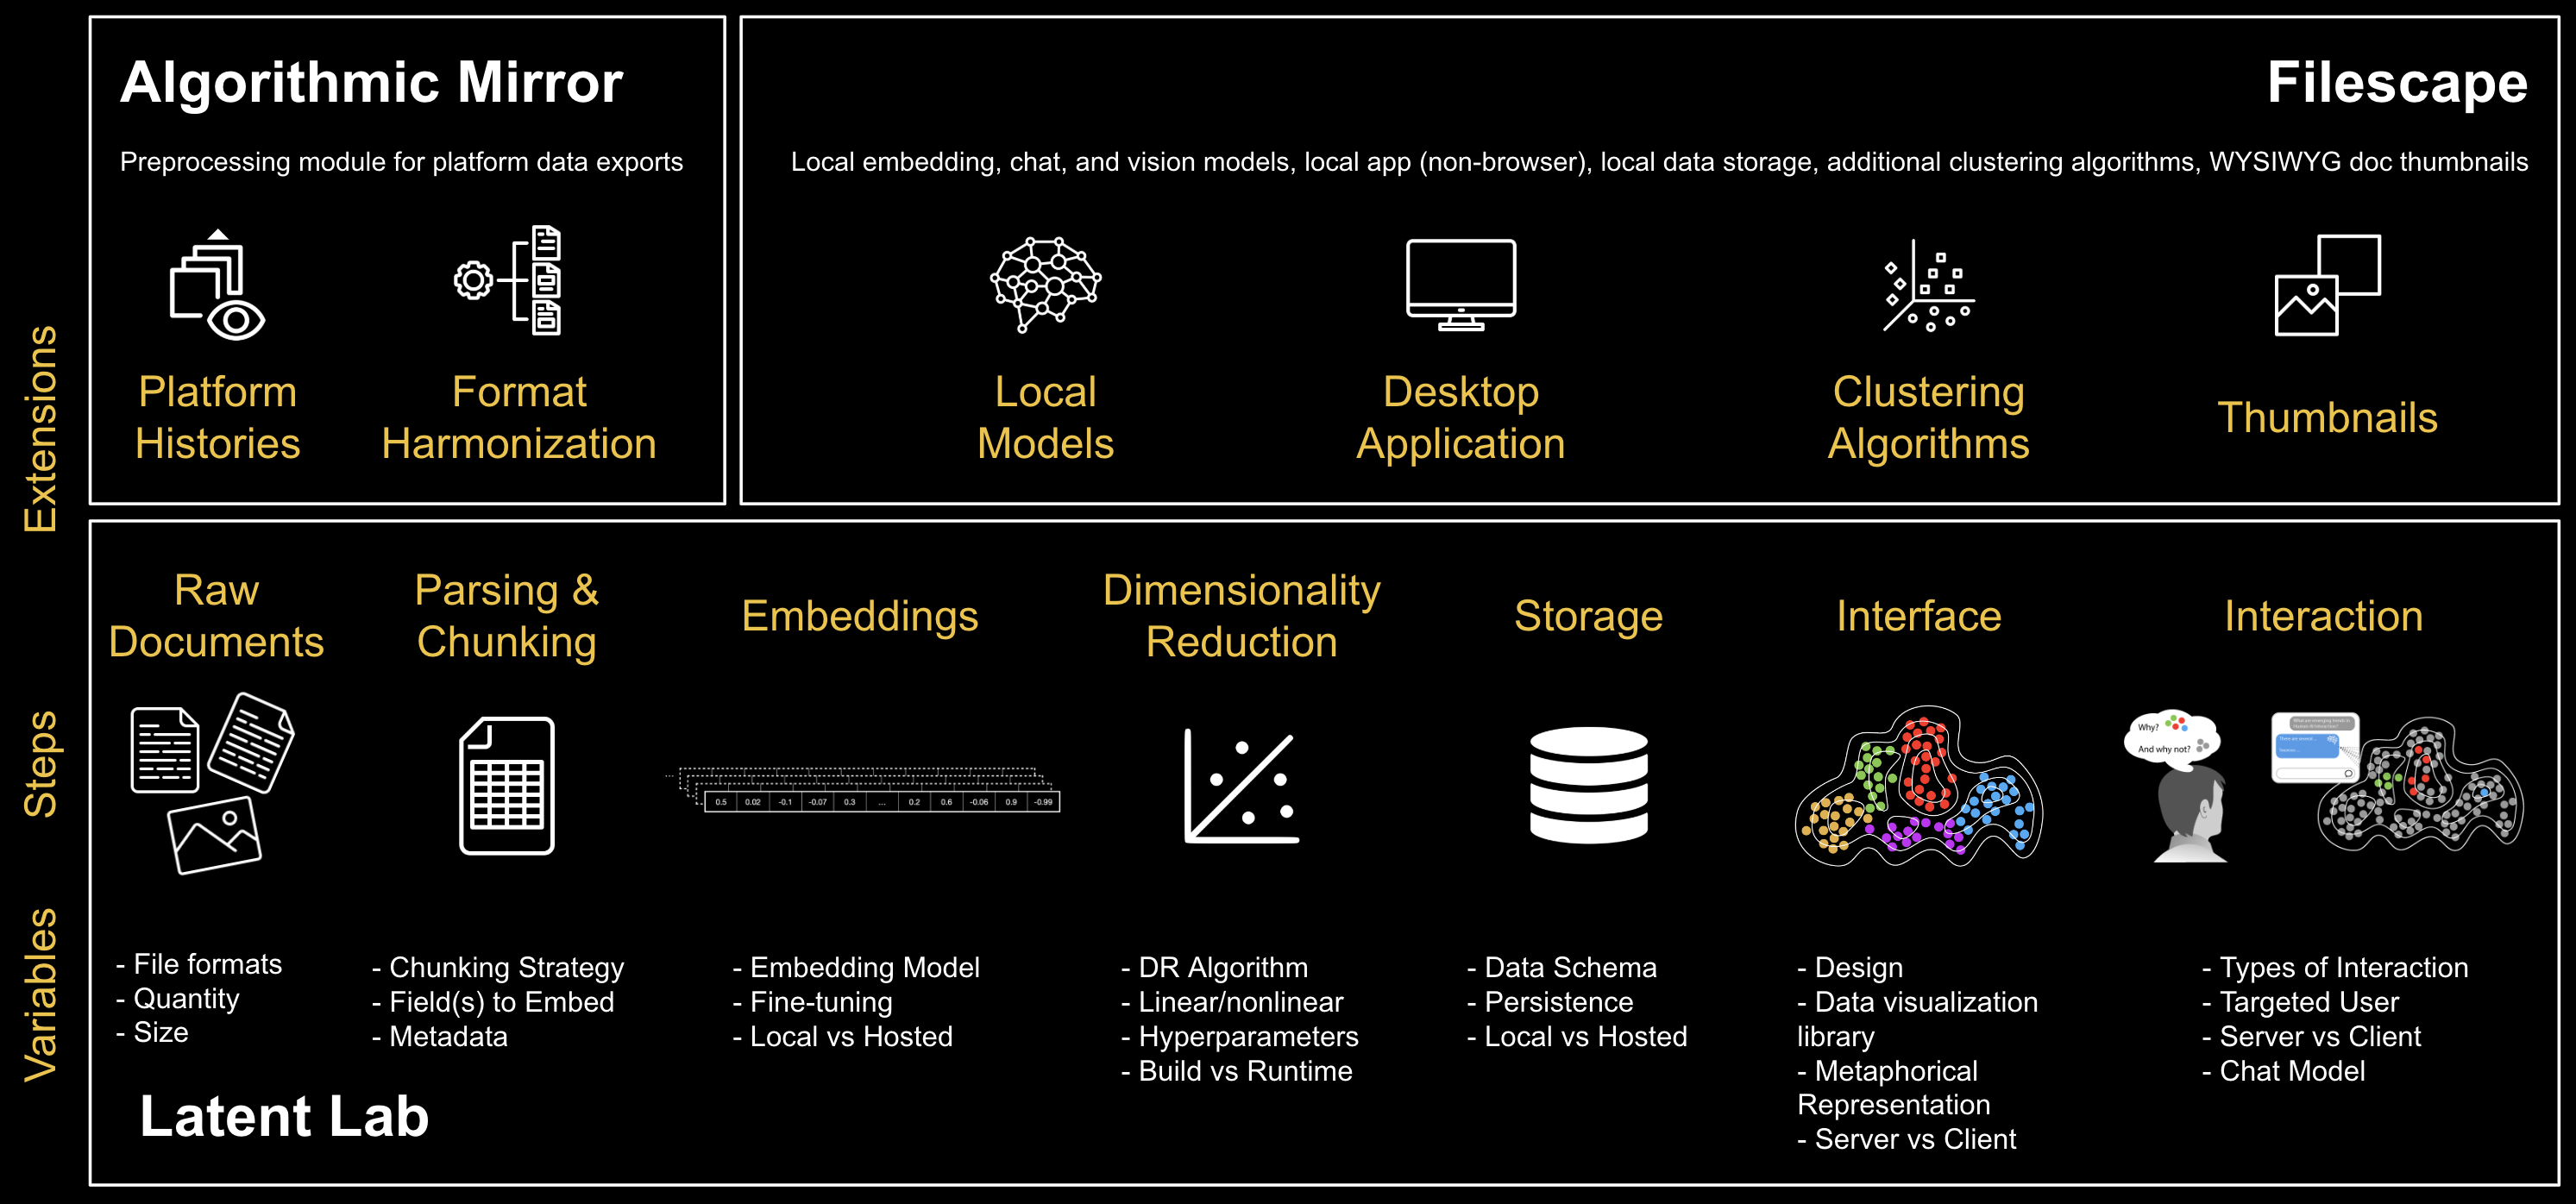
Latent Lab processes raw files end-to-end, from drag-and-drop to interactive semantic visualization. The pipeline handles parsing and chunking, embedding generation, dimensionality reduction, storage, interface rendering, and interaction. This end-to-end capability remains unique among tools in this space. Latent Lab serves as the technical foundation for two derivative projects: Filescape, which applies the platform to personal information management as an alternative to the desktop metaphor, and Algorithmic Mirror, which uses it to help adolescents see and reflect on the content they have consumed across social media platforms.
Gallery
Semantic axes for user-defined organization along custom dimensions
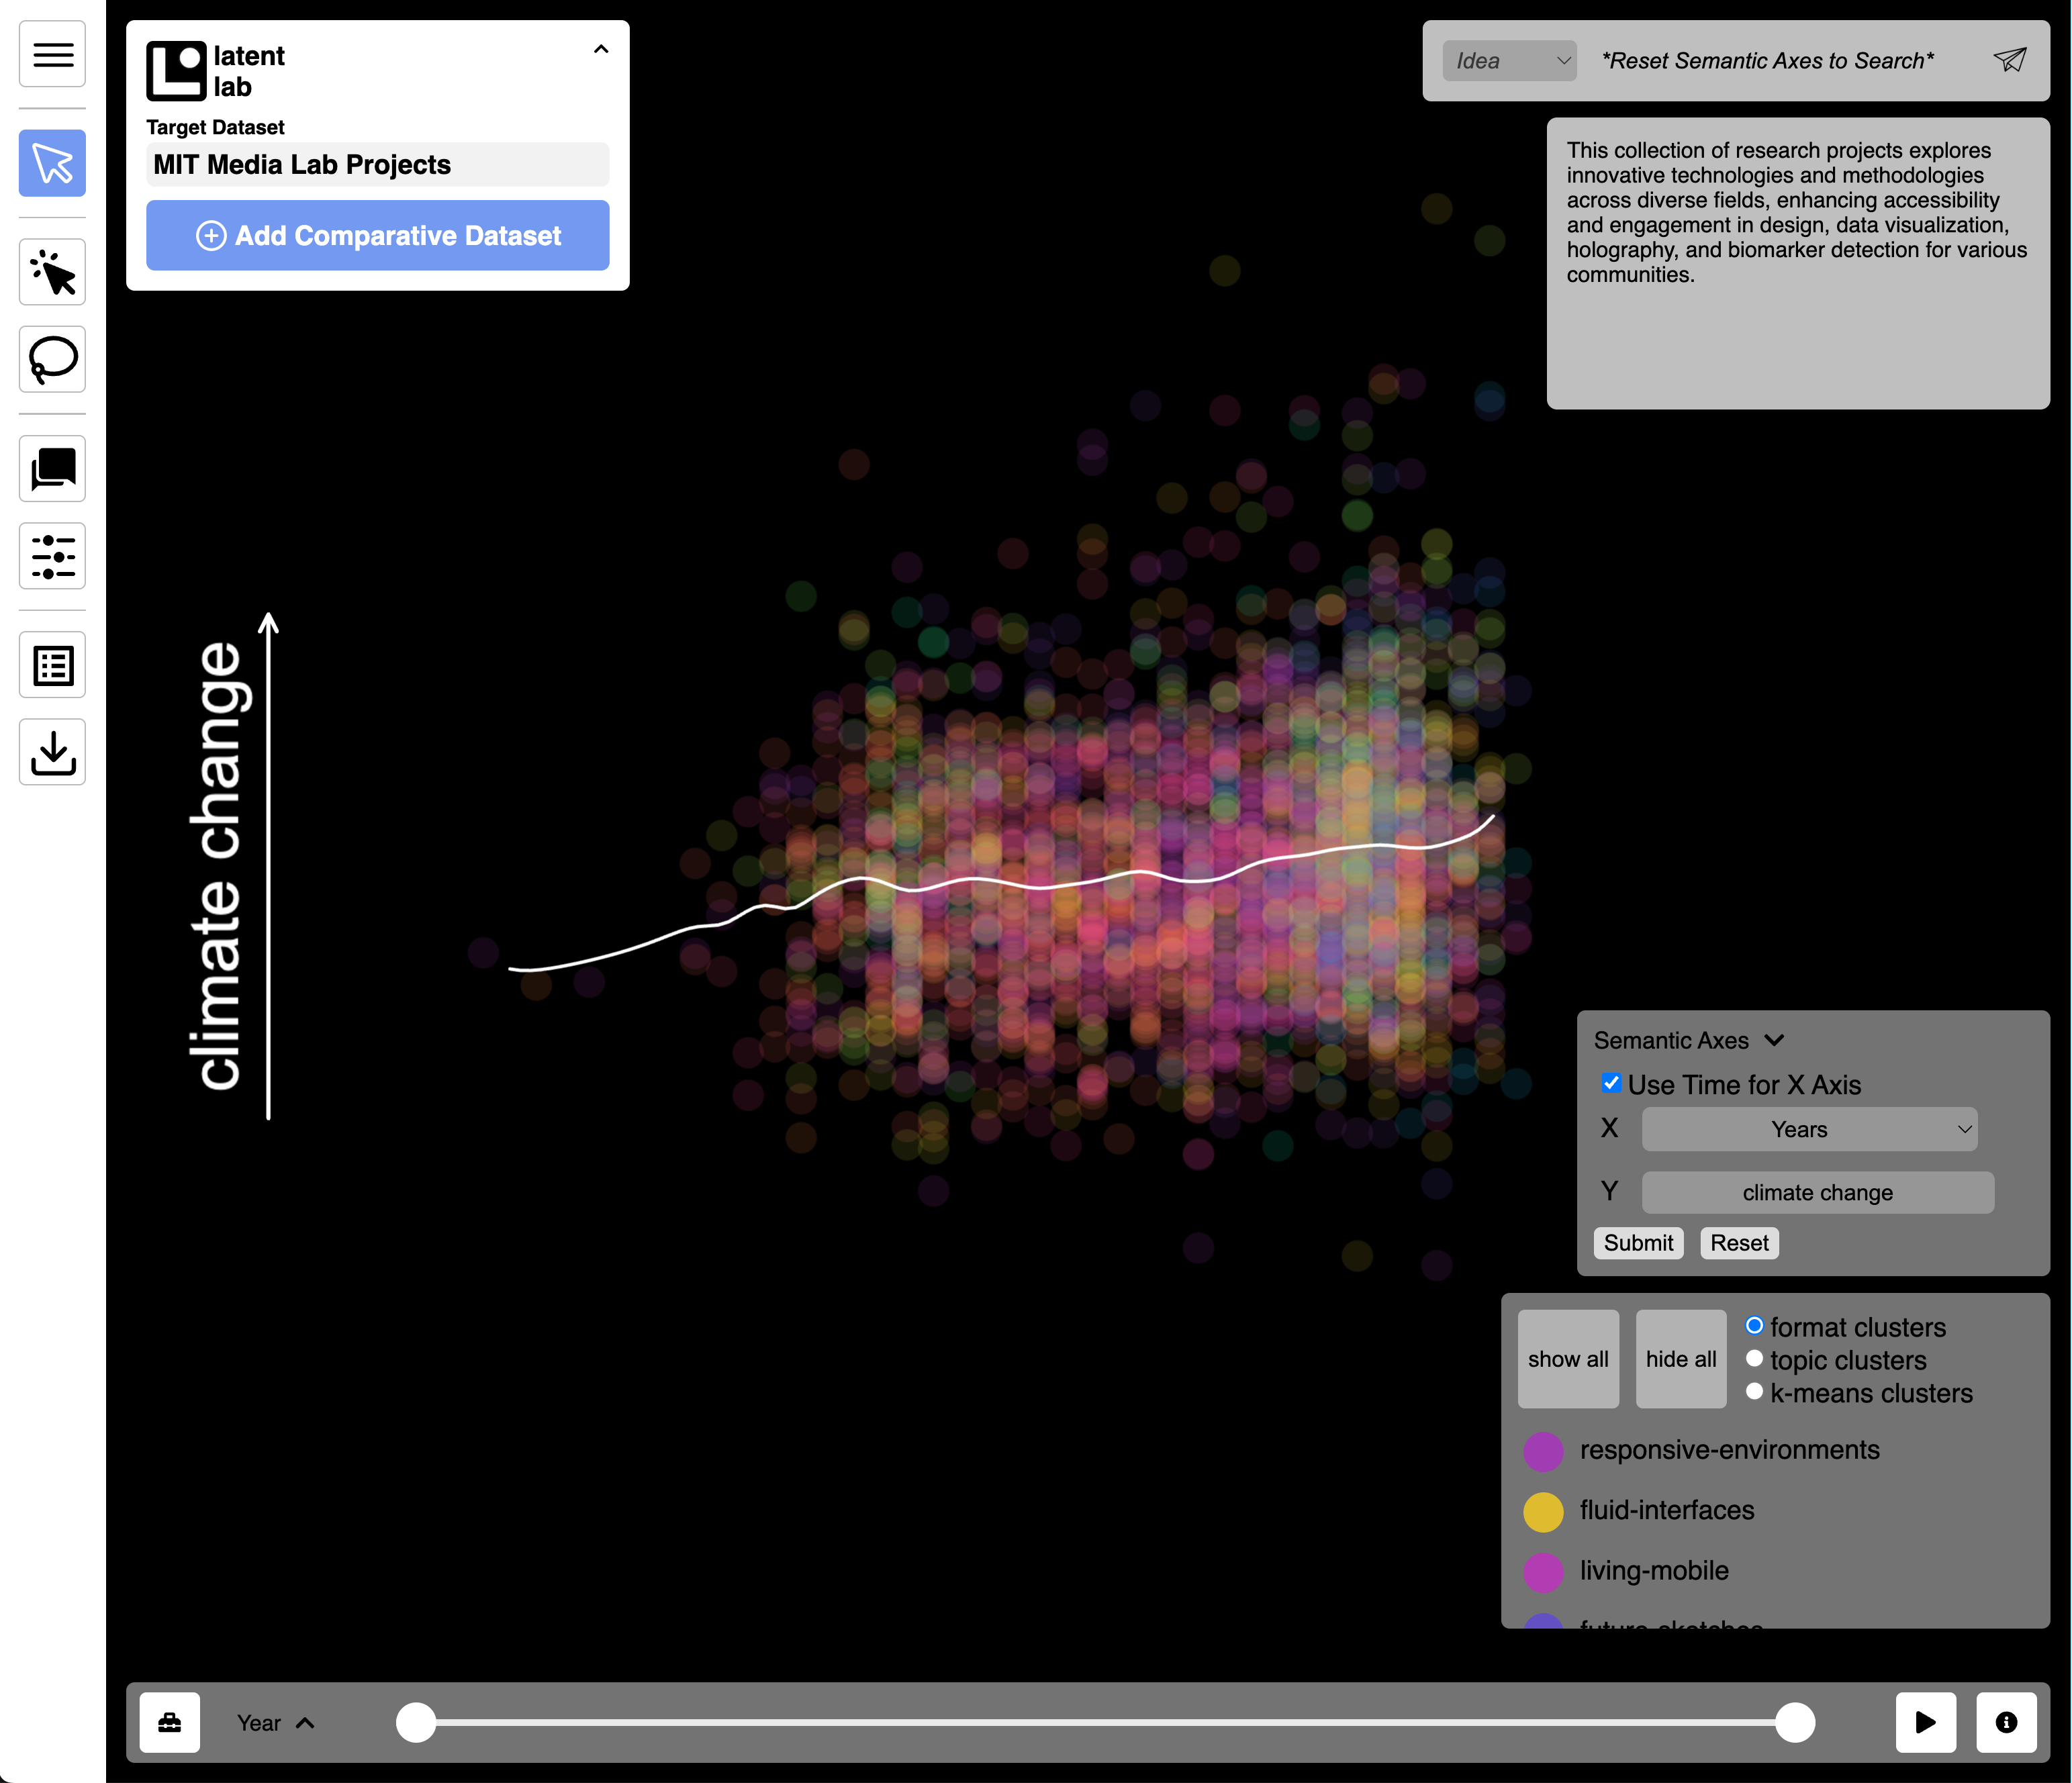
Media Lab projects organized by time (X) and climate change relevance (Y)
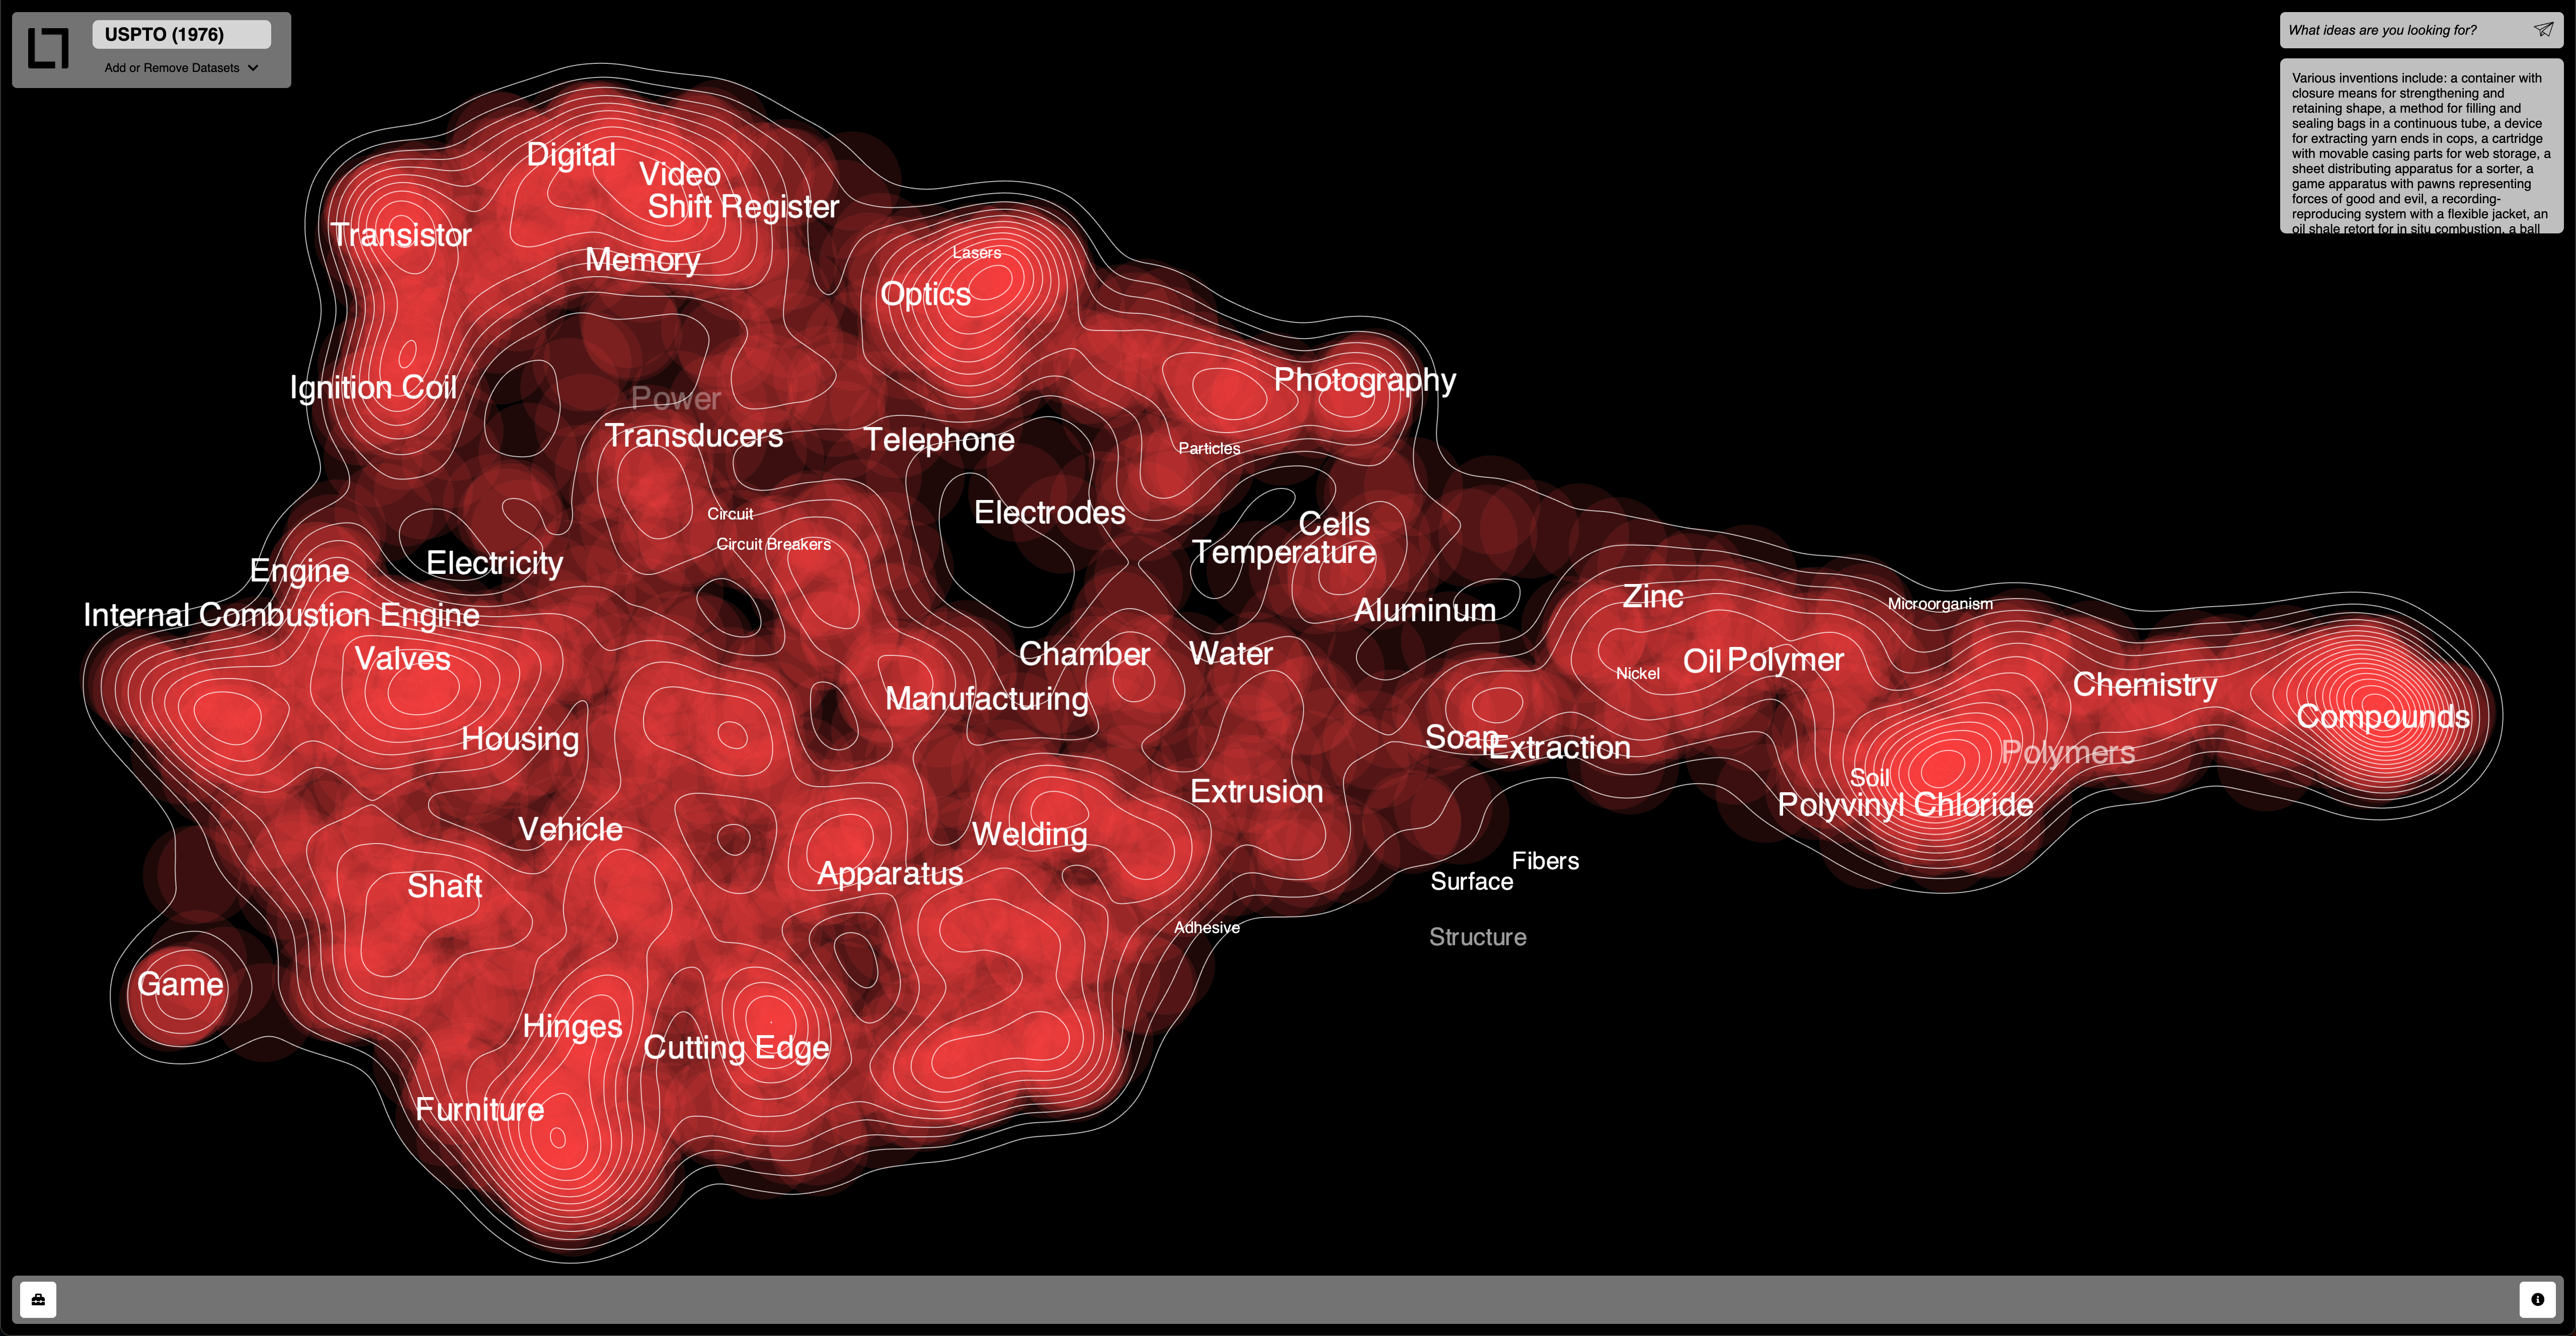
USPTO patent corpus visualized as a topographic density map
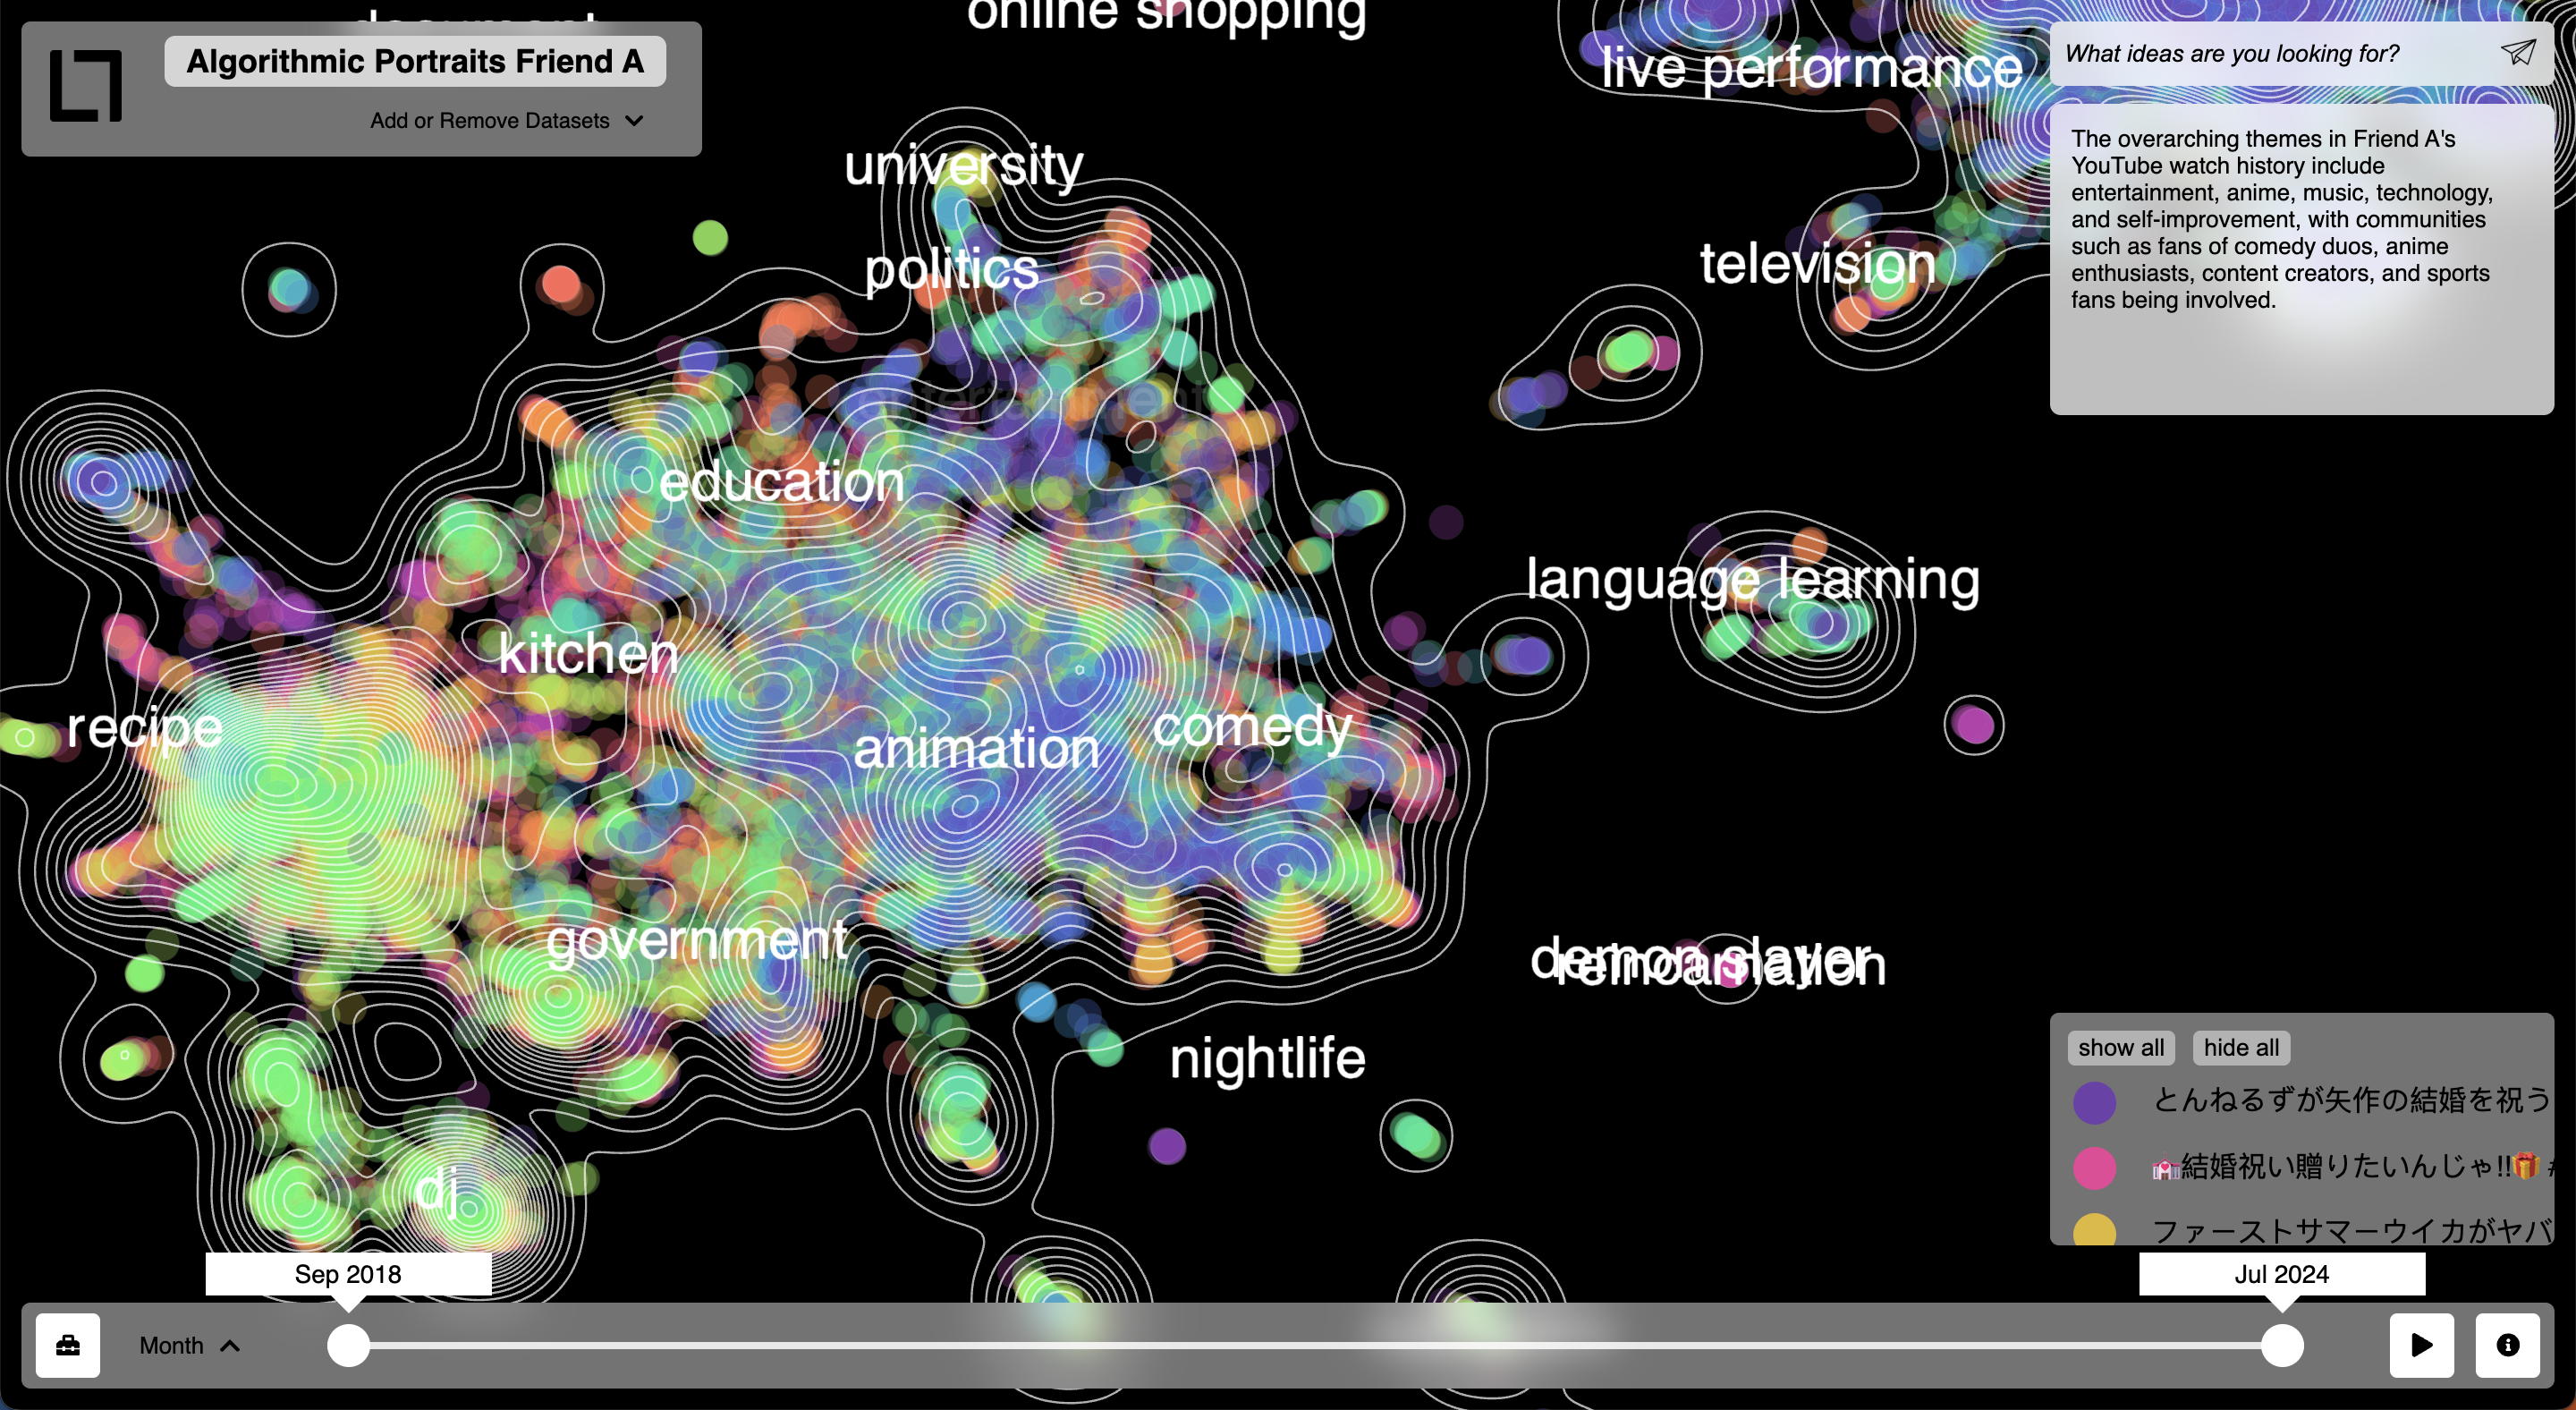
Algorithmic Mirror: a participant's YouTube history as a semantic landscape
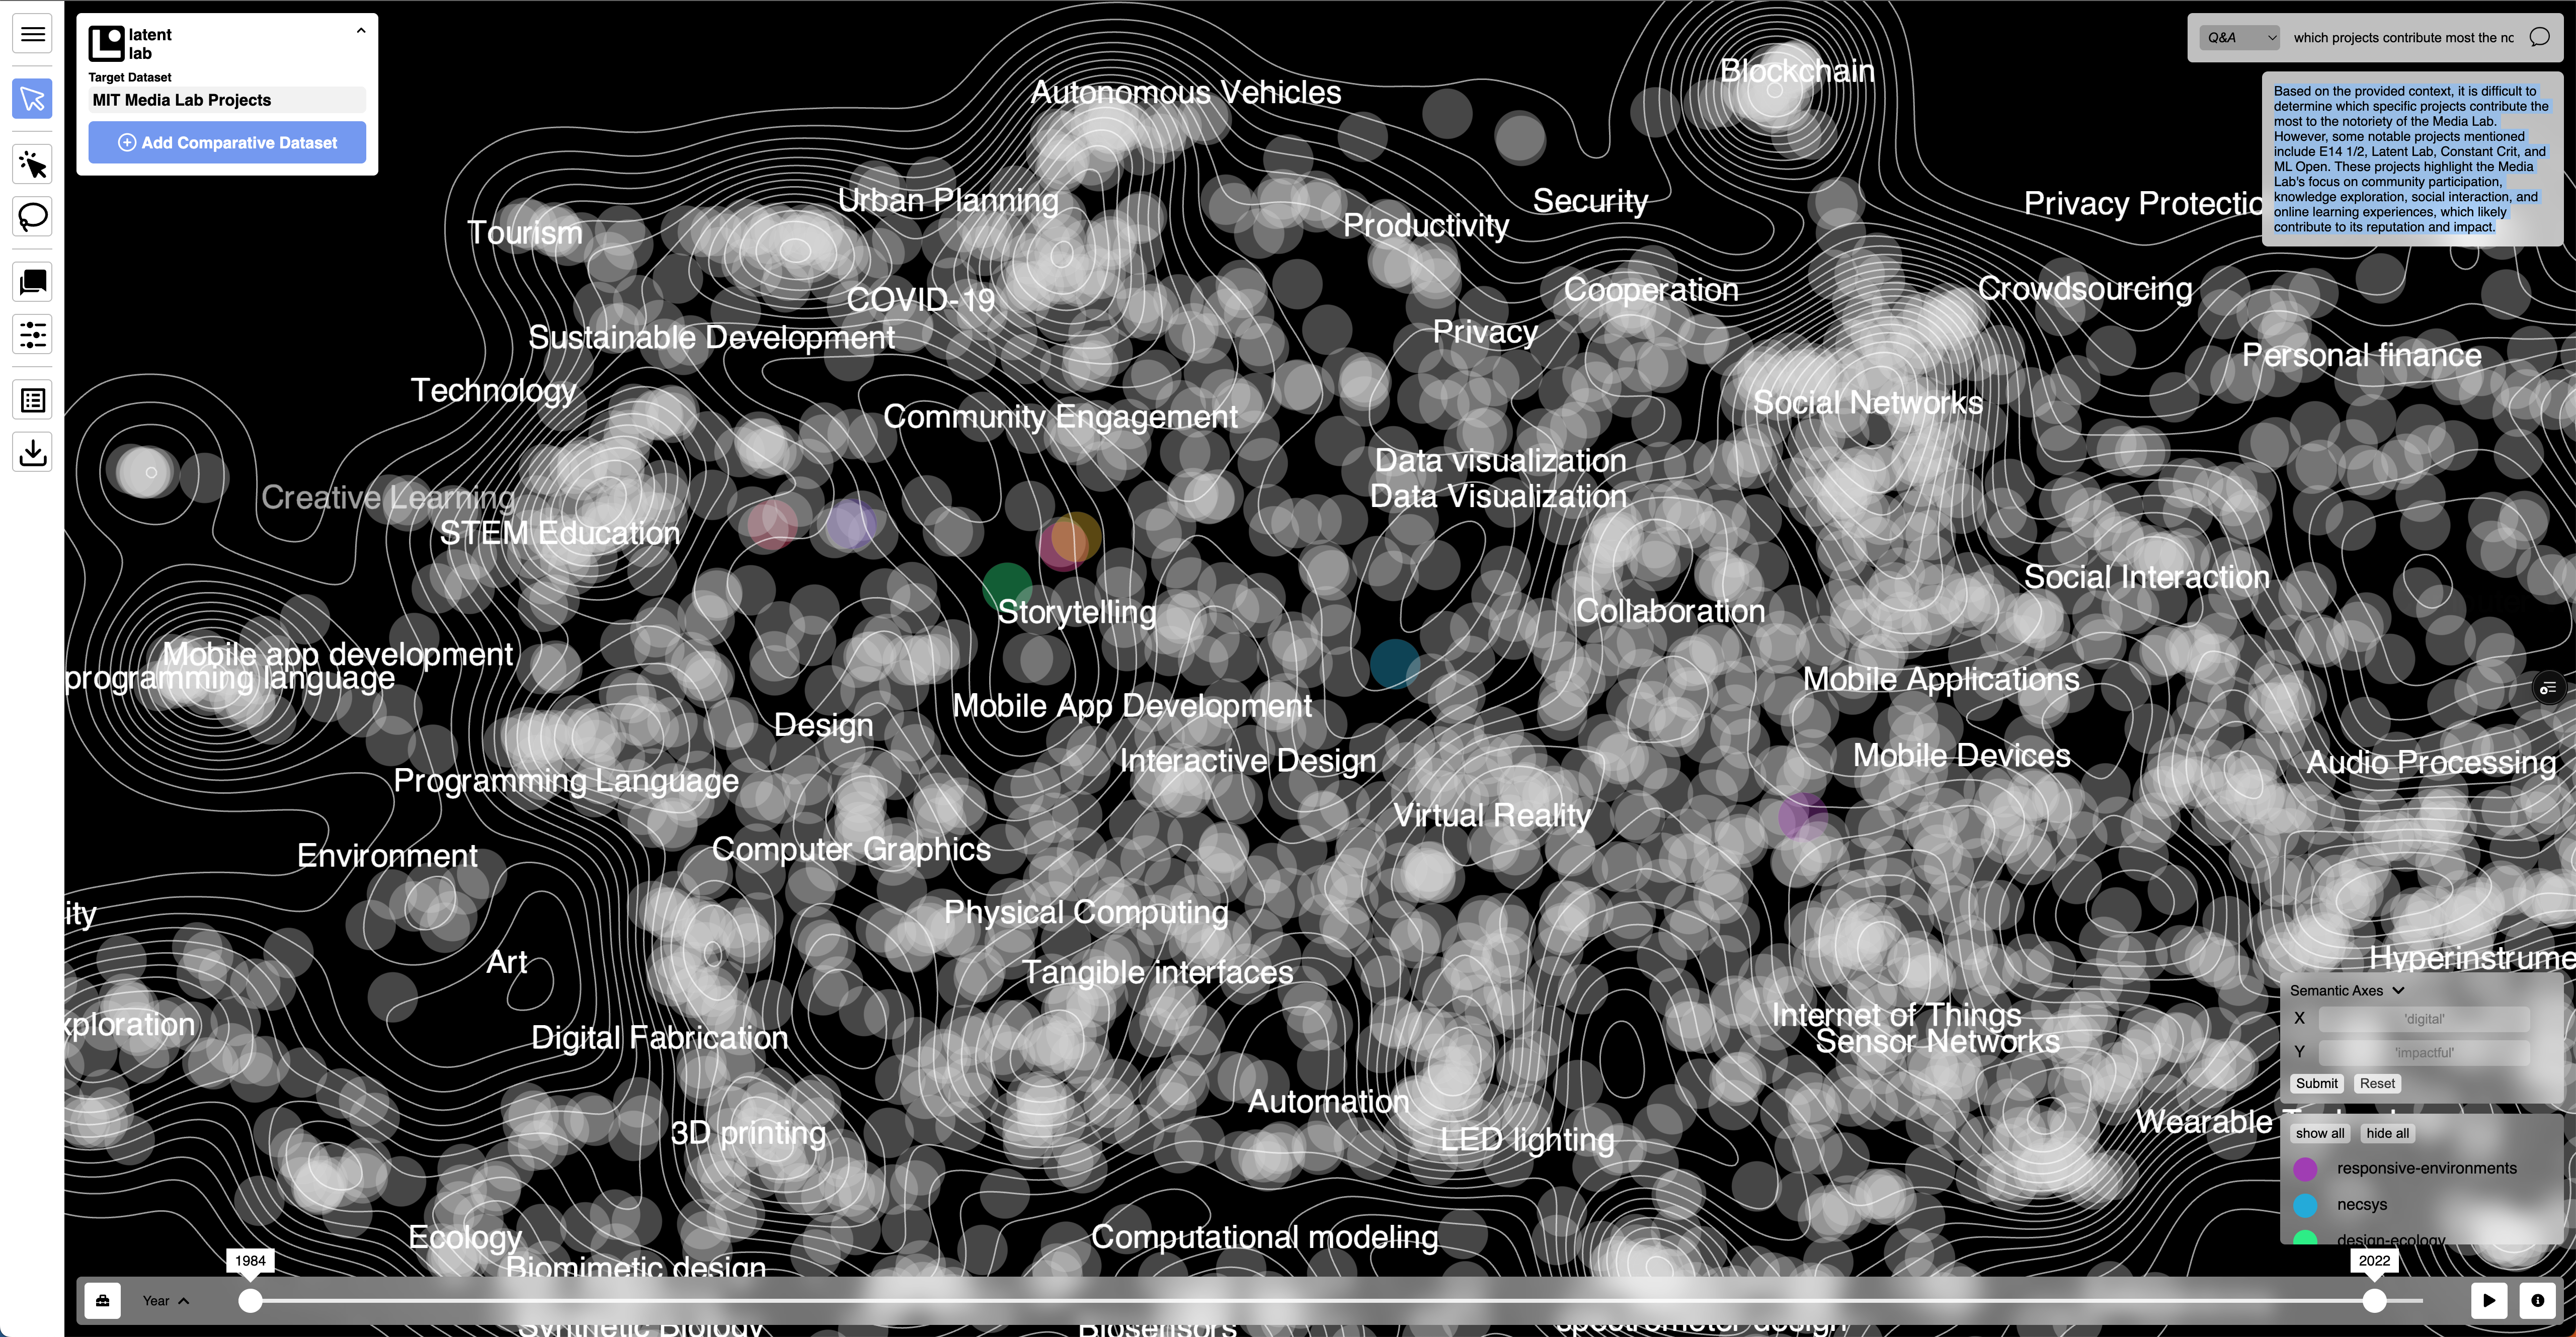
Visual RAG highlighting relevant items for QA
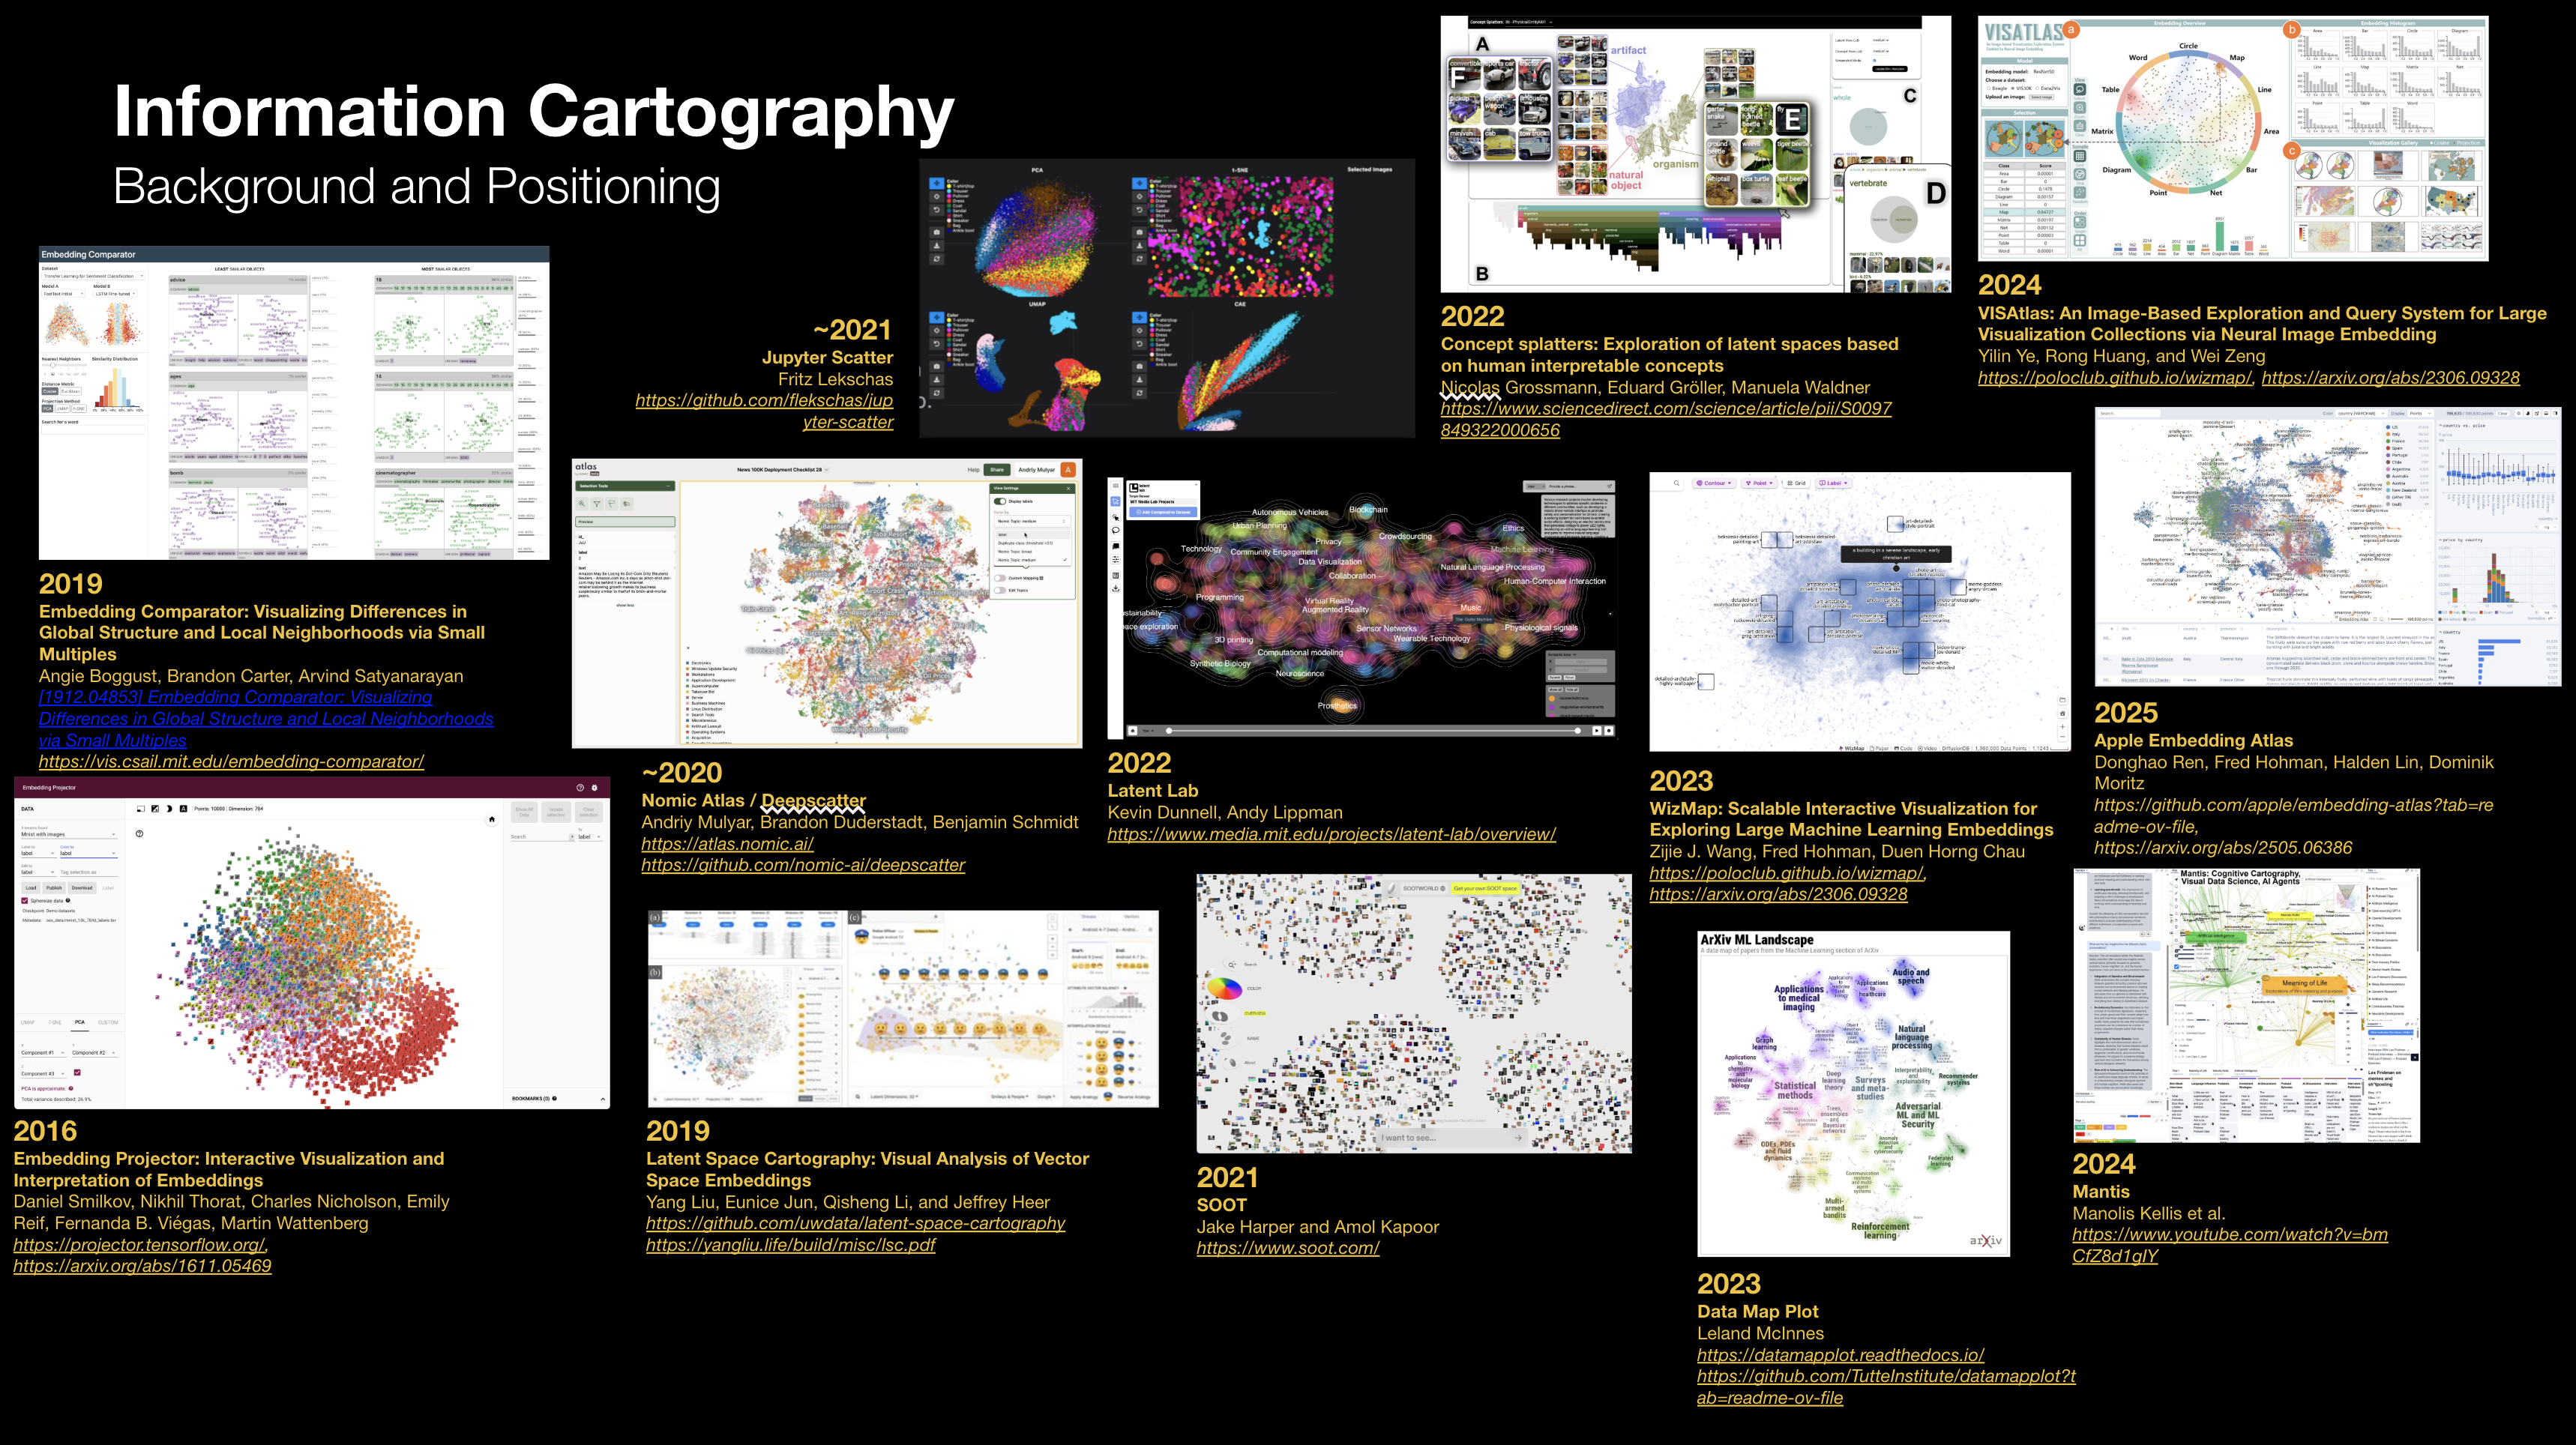
Background and positioning within the information cartography field (2016–2025)
Publications
- Latent Lab: Large Language Models for Knowledge Exploration
June 2023 · ICCC (International Conference on Computational Creativity)
- How AI Is Making Text And Multimodal Data More Interactive
May 2024 · Forbes
- Latent Lab: Exploration Beyond Search and Synthesis
June 2023 · DSpace@MIT